On this page10
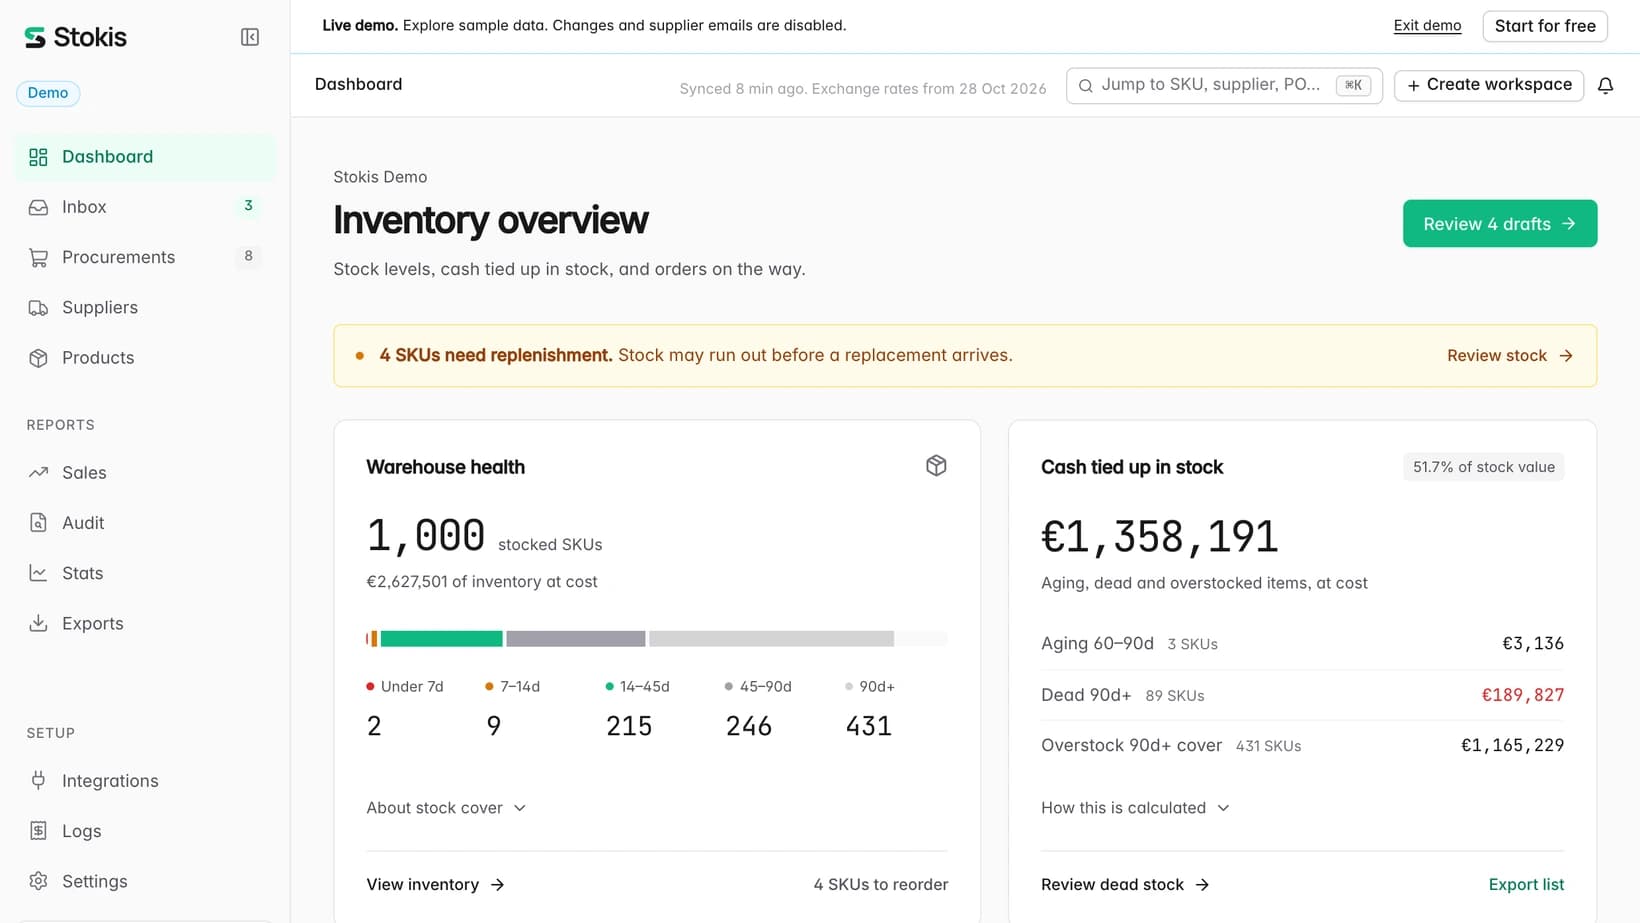
The inventory days formula is average inventory ÷ cost of goods sold × 365. It gives one number for the whole business: how many days of stock sit on the shelf. A shop needs the same idea per product, and that version is simpler: days of cover = stock on hand ÷ units sold per day. A product with 67 units on the shelf that sells 12.2 a day has 5 days of cover. Run it across a catalogue and the stock sorts itself. In the example store below, 1,000 stocked SKUs split five ways: 2 with under 7 days of cover, 9 with 7 to 14 days, 215 with 14 to 45 days, 246 with 45 to 90 days and 431 with more than 90. That last group holds €1,165,229 at cost. One number per product tells you what to order this week and what to stop ordering.
This guide gives both versions. First the accounting formula and its link to inventory turnover. Then the per-product version, applied to ten products on a real screen. Then the five bands a shop should sort its catalogue into, and a Monday routine built on them. The numbers and screenshots come from the Stokis demo workspace: a supplements shop with 1,000 stocked SKUs and two years of simulated sales, read on 29 October 2026. It is example data, not a customer's.
The inventory days formula, as accountants use it
Days of inventory, days sales of inventory (DSI), days inventory outstanding and days of inventory on hand are the same ratio with different names. Wikipedia defines it as an efficiency ratio that measures the average number of days a company holds its inventory. The inputs come from the accounts, not from the shelf.
| Part | What it means | Example |
|---|---|---|
| Average inventory | Stock on the balance sheet, at cost | $3,000 |
| Cost of goods sold | What the goods sold in the year cost you | $35,000 |
| Days in the period | A year | 365 |
| Inventory days | Inventory ÷ cost of goods sold × 365 | 31.29 |
So 3,000 ÷ 35,000 × 365 = 31 days: that brand holds about a month of sales, at cost. The same number comes out of inventory turnover. Inventory days = 365 ÷ turnover, so a turnover of 5 a year means 73 days, and a turnover of 8 means 46 days. If you already track turnover, you already have inventory days. The Corporate Finance Institute's page has two more brands worked the same way.
What is a good number? It depends on what you sell, and a grocer and a furniture maker cannot be judged by the same figure. For scale, the US Census Bureau's monthly inventories and sales release gives the national version. At the end of August 2026, US manufacturers, wholesalers and retailers together held $2,818.8 billion of inventory against $2,123.5 billion of monthly sales, an inventories to sales ratio of 1.33. That is 1.33 months of sales on hand, or about 40 days, measured at selling prices rather than cost. A year earlier the ratio was 1.40.
The accounting version has one weakness for a shop: it is one number, for a year, for everything. A product that ran out in March and a pallet that has not sold since March average out to a healthy figure. The number is right, and it still says nothing about what to order on Monday.
Quick takeaway: inventory days = average inventory ÷ cost of goods sold × 365, or 365 ÷ inventory turnover. Use it to compare years and to compare with peers. Do not use it to decide what to buy.
The per-product inventory days formula a shop can act on
For one product the formula drops the money and uses units: days of cover = stock on hand ÷ units sold per day. Daily sales are the units sold in the last 30 days ÷ 30. A product with 67 on hand that sold 366 in the last 30 days sells 12.2 a day. So it has 67 ÷ 12.2 = 5.5 days of cover, which rounds to 5. Stokis calls this stock cover; other tools say days on hand or days of supply. It is the inventory days formula for one shelf instead of one balance sheet.
| Product | On hand | Sold, 30 days | Per day | Days of cover | Band |
|---|---|---|---|---|---|
| 5-HTP 100mg, 60 tabs | 7 | 55 | 1.8 | 4 | Under 7 days |
| Iron bisglycinate 25mg, 120 caps | 67 | 366 | 12.2 | 5 | Under 7 days |
| Cod liver oil, 90 softgels | 120 | 458 | 15.3 | 8 | 7–14 days |
| Collagen gummies, 60 caps | 63 | 144 | 4.8 | 13 | 7–14 days |
| Propolis, 90 caps | 14 | 25 | 0.8 | 17 | 14–45 days |
| VitaCore Hair, skin & nails, 500g | 898 | 722 | 24.1 | 37 | 14–45 days |
| OptiLife Hair, skin & nails, 90 caps | 155 | 114 | 3.8 | 41 | 14–45 days |
| NutriNord Hair, skin & nails, 300g | 432 | 266 | 8.9 | 49 | 45–90 days |
| Marine collagen, 90 caps | 416 | 250 | 8.3 | 50 | 45–90 days |
| Biotin 10000µg, 500g | 735 | 54 | 1.8 | 408 | 90+ days |
Two things to notice. The biotin and the propolis sell at almost the same rate, 1.8 against 0.8 a day, but one has 408 days of cover and the other 17. And the iron, the second-best seller in the list, has the thinnest cover of all. A rule like "reorder when stock drops below a fixed number of units" would call the biotin safe and the iron safe too. Only days of cover gets both right.
You can do this in a spreadsheet with two exports: products with stock on hand, and order lines for the last 30 days. Sum the units per SKU, divide by 30, then divide stock by that rate. Our dead stock guide walks through the same two exports. The spreadsheet goes stale the day you make it, which is why the rest of this post uses a screen that recalculates after every sync.
Quick takeaway: the per-product inventory days formula is days of cover = stock on hand ÷ (units sold in 30 days ÷ 30). Units, not money; one number per product; recompute it every week.
Five bands of days of cover, and what each one asks you to do
A thousand numbers are no easier to act on than one. Stokis sorts every measured SKU into five bands, and the bands are the whole Monday routine. The two on the left are orders to place. The one on the right is orders not to place. The table shows the rule for each band, what the example store had in it, and the job it gives you.
| Band | SKUs | What it means | Monday job |
|---|---|---|---|
| Under 7 days | 2 | Stock runs out this week | Order today, unless a delivery lands first |
| 7–14 days | 9 | Watch list: a delivery takes about as long as this stock lasts | Order this week if the lead time is a week or more |
| 14–45 days | 215 | Healthy: enough for the lead time plus a month between orders | Nothing |
| 45–90 days | 246 | Heavy but fine: more than you need, still selling | Skip this product on the next order |
| 90+ days | 431 | Parked: three months or more of stock | Stop ordering; find out why it stopped selling |
| No sales in 30 days | 97 | Cover unknown rather than infinite: new, seasonal or dead | Check the dead stock view |
The left end is loud and small: 2 SKUs and €403 at risk. The right end is quiet and huge: 431 SKUs, 43% of the catalogue, holding €1,165,229 at cost, 44% of all stock value. Add the 89 dead products and the 3 aging ones from the card beside it. The store has €1,358,191 of idle capital, 51.7% of what it paid for its stock. No low-stock alert would ever show you that. The band on the right is where a shop's cash goes to sleep, and the inventory days formula is the only alert that rings for it.
Quick takeaway: under 7 days means order today; 7 to 14 means order this week; over 90 means stop. The right end of the bar holds more money than the left end ever will.
The same stock, three ways to measure daily sales
The inventory days formula has one knob: how many days of sales you average. Stokis lets you switch the dashboard between 7 days, 30 days and 90 days. The table shows what that does to the same 1,000 SKUs on the same day.
| Window | Under 7 | 7–14 | 14–45 | 45–90 | 90+ | No sales in window | Flagged to reorder |
|---|---|---|---|---|---|---|---|
| 7 days | 3 | 9 | 215 | 251 | 381 | 141 | 6 |
| 30 days | 2 | 9 | 215 | 246 | 431 | 97 | 4 |
| 90 days | 1 | 4 | 186 | 265 | 455 | 89 | 3 |
A short window reacts fast and forgets fast. With 7 days, 141 SKUs had no sale at all and could not be placed, and two more products were flagged for reorder. A long window is calm but slow. With 90 days the average still includes the end of summer, so 455 SKUs look parked and the slowest sellers are flagged later. The 30-day window is the right default for most shops. Use 90 days for ranges that sell a few units a month, and 7 days only while a promotion is running.
Before and after one order cycle
Stokis flags a SKU when its days of cover are shorter than the supplier's lead time plus 3 days of slack. On 29 October the example store had four such SKUs. Each product page shows the quantity Stokis would order. Add that quantity to the shelf, run the inventory days formula again, and you get the days of cover on the day the order goes out.
| Product | Days today | Order quantity | Days after | Band after |
|---|---|---|---|---|
| 5-HTP 100mg, 60 tabs | 4 | 66 | 40 | 14–45 days |
| Iron bisglycinate 25mg, 120 caps | 5 | 439 | 41 | 14–45 days |
| Cod liver oil, 90 softgels | 8 | 617 | 48 | 45–90 days |
| Propolis, 90 caps | 17 | 33 | 56 | 45–90 days |
Two honest notes on those numbers. The Forecast tab shows 21 days of cover for the propolis where the plain formula gives 17. The forecast rate is smoothed and skips days the product was out of stock. And "days after" counts the order as if it were already on the shelf. By the time the propolis delivery lands, 15 days later, about 12 more units will have sold, so the figure on arrival is closer to 41 days. The table is about the direction, not the decimal.
The chart puts the four orders back into the bands. The left end empties: 2 becomes 0 and 9 becomes 8. The middle band grows by one and the 45 to 90 band by two. The 431 SKUs on the right do not move, because no order ever moves them. An order cycle fixes the left end of the bar. Only not ordering, and selling down, fixes the right end.
Quick takeaway: ordering moves SKUs from the left bands to the middle. Nothing you order will shrink the 90+ band; only selling, returning or clearing stock does.
How to check days of cover every Monday in Stokis
Stokis recomputes days of cover for every product after each sync, from the order history your store already has. The routine below takes about ten minutes. The dashboard it uses is described on the product page.
Step 1: connect your store
Follow the PrestaShop, WooCommerce or OpenCart setup guide. Stokis imports products, stock, costs and orders. Days of cover need nothing else, but give each supplier a lead time, because the reorder flag compares cover with it. Our reorder point guide shows where that setting lives.
Step 2: read the bar on the dashboard
Open the dashboard. The Warehouse health card shows the five bands and the count in each. Click a band for its share of the catalogue and the money behind it. The range control above the sales chart sets the window. Leave it on 30 days unless the table above gave you a reason.
Step 3: open the SKUs to reorder
The link at the bottom of the card opens the Products page on its Stockout risk tab. It lists every SKU whose cover is shorter than its lead time plus 3 days, with on-hand units and 30-day sales beside each one. Open a product and its Forecast tab shows the quantity to order and why. If the agent is on, these are the drafts waiting for your approval.
Step 4: walk the right end of the bar
Click the 90+ band, then Review dead stock on the card beside it. Everything there is cash on a shelf. Stop reordering first, then decide product by product, as the dead stock guide lays out. This is the step most shops skip, and it is the one that frees money.
Step 5: approve the drafts
If the agent is on, the orders for flagged SKUs are drafted for you, one per supplier. Review each one, change a quantity if you know something the sales history does not, and send it. Nothing is emailed until you do.
What days of cover in Stokis does not do yet
- It does not count stock on order. A product with a delivery landing tomorrow shows the same days of cover as one with nothing coming. Check the product's Purchase orders tab before you order twice.
- The rate is a plain average over the window you pick, a week, a month or 90 days. It has no seasonality in it. The Forecast tab's rate does, which is why the two can disagree by a few days, as the propolis showed.
- The bands are fixed at 7 days, 14 days, 45 days and 90 days. You cannot set your own thresholds yet.
- Days are rounded to whole numbers, and a SKU with no sale in the window is left out of the bands rather than shown as infinite.
- Stokis does not compute the accounting inventory days formula, average inventory ÷ cost of goods sold × 365. Take that one from your accounts.
Frequently asked questions
What is the inventory days formula?
The inventory days formula is average inventory ÷ cost of goods sold × 365. Average inventory is the mean of the opening and closing balance; many people just use the closing figure. The result is the number of days of sales, at cost, held in stock.
Is days of inventory the same as days sales of inventory?
Yes. Days of inventory, days sales of inventory, days inventory outstanding and days of inventory on hand are one ratio with four names. Days of cover, or stock cover, is the per-product version: units on hand ÷ units sold per day.
What is a good number of inventory days?
For a company, compare with your own past years and with peers in the same trade. US business as a whole held about 40 days of sales in August 2026, at selling prices. For one product in an online shop, aim for the supplier's lead time plus the gap between your orders, usually 14 to 45 days. Under the lead time means a stockout is coming; over 90 days means cash is parked.
How do inventory days relate to inventory turnover?
The inventory days formula and the turnover ratio are the same fact seen from two sides. Inventory days = 365 ÷ inventory turnover, and turnover = 365 ÷ inventory days. A turnover of 5 a year is 73 days of inventory.
See days of cover for every product in your store
Connect your store and Stokis applies the per-product inventory days formula to everything you sell. Every product lands in one of the five bands after each sync. Start with the PrestaShop or WooCommerce setup guide. The first 30 days include every Growth feature, with no card. See the pricing page for what comes after.
Sources
- Days in inventory, Wikipedia.
- Days Inventory Outstanding, Corporate Finance Institute.
- Manufacturing and Trade Inventories and Sales: August 2026, US Census Bureau.
AI tools draft parts of our articles; a person checks the facts and edits every one before it is published. Found a mistake? Write to [email protected]. How we write