On this page11
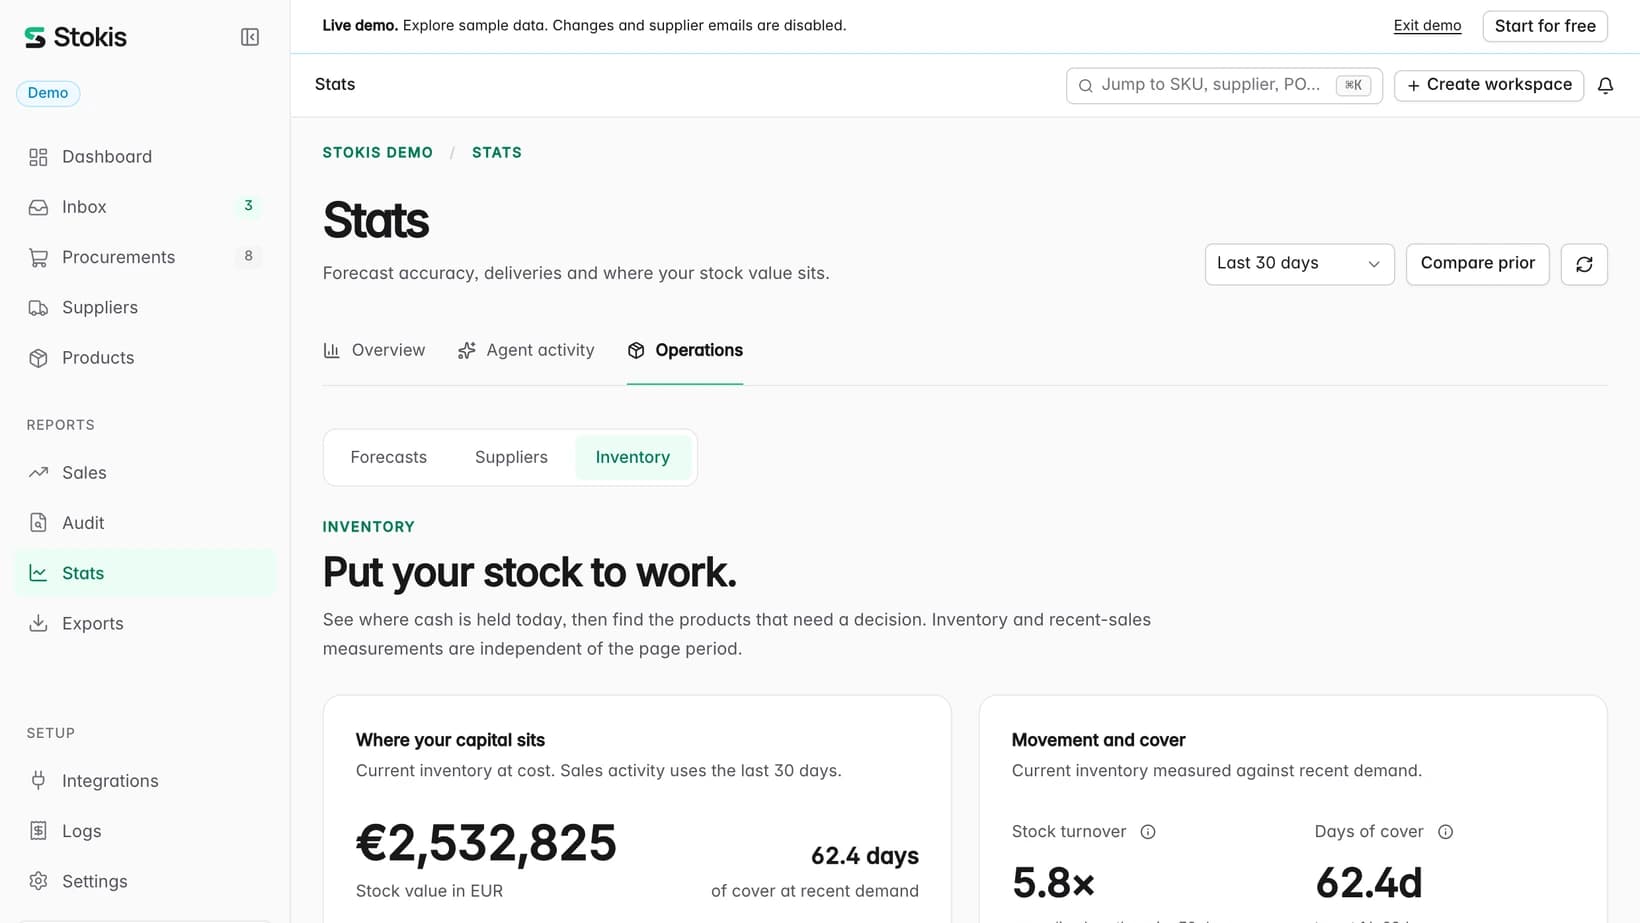
The inventory turnover ratio is cost of goods sold divided by average inventory. It tells you how many times a year your stock sells through and gets replaced. In the example store we use for this post, the whole shop comes out at 5.8. That one number hides an elderberry extract turning 35.9 times a year and a vitamin K2 turning 0.01 times: about once a century.
This guide gives you the formula, then works it out for each product instead of once for the shop. It shows what the average hides, why missing cost prices break the usual version, and how turns become days of cover. The numbers and screenshots come from the Stokis demo workspace: a supplements shop with 1,000 stocked products and two years of simulated sales, read on 9 November 2026. It is example data, not a customer's.
The inventory turnover ratio formula
The textbook inventory turnover formula has two inputs:
- Inventory turnover = cost of goods sold ÷ average inventory
- Average inventory = (inventory at the start + inventory at the end) ÷ 2
Both are in money, at what you paid. Here is the calculation for one product over twelve months. Hover or tap the dotted terms for the detail.
| Part | What it means | Example |
|---|---|---|
| Cost of goods sold | What you paid for the units you sold | €80,258 |
| Inventory | The stock you hold, at cost | €6,925 |
| Turnover at cost | €80,258 ÷ €6,925 | 11.6 |
| Turnover in units | Units sold ÷ units in stock | 11.6 |
Look at the last two rows. For a single product, the unit cost sits on both sides of the division and cancels, as long as it stayed about the same during the year. So units sold ÷ units in stock gives the same answer, and you can work it out without a single cost price.
One caution about the bottom of that fraction. Today's stock is a stand-in for the average. If a big delivery landed yesterday, the ratio looks worse than it is. If the product is nearly sold out, it looks better. Take stock at the start and end of the year when you have both.
Quick takeaway: turnover is cost of goods sold ÷ average inventory. For one product, units sold ÷ units in stock is the same number, and it needs no cost data.
What the whole-shop number hides
A shop-level inventory turnover ratio adds up all sales and divides by all stock, so the best sellers push it up and the slow products disappear into the total. The chart puts the whole shop next to twelve of its products, from the first and last pages of the Sales table. The orange line is the shop.
Twelve products, and they span more than three orders of magnitude. A shop owner who reads "5.8" and relaxes has not seen the bottom half of this chart. Here are the two ends of the same table, the way Stokis shows them.
The 25 slowest sellers on that first page sold between 2 and 16 units in twelve months. Not one of them reaches a single turn a year: the best is 0.8. Together they hold 4,157 units and €60,387 at cost, and they sold 186 units. And this list only includes products that sold at all. Stock with no sale in the period is not on it.
Quick takeaway: a healthy shop average can sit on top of products that will never sell through. Work out the ratio per product and sort it from low to high.
From turnover rate to days of cover
Turns are good for an accountant. Days are better for ordering, because you can compare them with a lead time. The conversion is one division: days of cover = 365 ÷ turnover. The example store's 5.8 turns gives 365 ÷ 5.8 = 63 days. The Stats page shows 62.4, because it works from the last 30 days and the ratio on screen is rounded. There is more on this in our inventory days formula post.
| Days of cover | Turns a year | Products |
|---|---|---|
| Under 7 | More than 52 | 2 |
| 7 to 14 | 26 to 52 | 15 |
| 14 to 45 | 8 to 26 | 229 |
| 45 to 90 | 4 to 8 | 240 |
| 90 or more | Fewer than 4 | 415 |
| Not measured | — | 99 |
The shop's 5.8 turns falls in the 45 to 90 day band, which looks fine. Yet 415 of the 1,000 products turn fewer than four times a year, and they hold €1,124,277 at cost. That is 44% of the €2,532,830 in stock.
Why the at-cost formula lies without cost prices
The per-product shortcut works in units. The shop-level formula does not: it adds up money, so it needs a cost for every product. PrestaShop has a field for this, wholesale_price, but a product sells just as well with the field left empty. When costs are missing, the ratio goes wrong in two ways.
| Mistake | Example | Correct | Reported |
|---|---|---|---|
| A blank cost counts as zero | Two products, one with no cost price | 5.6 | 11.6 |
| Sales used instead of cost | Hair, skin & nails complex, 300g | 20.5 | 57.4 |
| Sales used instead of cost | Magnesium citrate 300mg, 240 tabs | 11.6 | 15.5 |
The first row is the dangerous one. One empty field took a slow product out of both sides of the sum, and the ratio doubled. If the products with blank costs are your slow ones, the error flatters you exactly where you can least afford it.
The second mistake changes the order as well as the size. The high-margin product is inflated 2.8 times and the low-margin one 1.3 times. Some published industry figures use sales on purpose, so check which version you are comparing with.
Quick takeaway: never treat a blank cost as zero. Compare products in units, and quote a shop-level figure at cost only when you know how many products have a cost price.
How to calculate inventory turnover for every product
You need two exports and three columns. Any shop on PrestaShop, WooCommerce or OpenCart can produce both files.
- Export your products with SKU and stock on hand, at variant level. Put them on a sheet called Products, in columns A and B.
- Export your order lines for the last twelve months: SKU in A, quantity in B, order date in C. Keep paid and shipped orders only. Call the sheet Orders.
- Add the three columns below and copy them down.
- Sort by turns, lowest first. Blank rows have no stock or no sales, so check those separately.
| Column | Formula |
|---|---|
| C: Units sold | =SUMIFS(Orders!B:B, Orders!A:A, A2, Orders!C:C, ">="&TODAY()-365) |
| D: Turns a year | =IF(B2>0, C2/B2, "") |
| E: Days of cover | =IF(C2>0, B2/(C2/365), "") |
Three things will skew the result:
- New products. A product listed three months ago has only a quarter of a year of sales. Divide by the months it has been on sale and multiply by twelve.
- Stockouts. A product that was sold out for half the year shows low sales because you had none to sell, not because nobody wanted it.
- Seasonal ranges. Judge a winter product after winter, and against last winter.
What to do with each band
These bands are our starting points, not a standard. Move them to suit your own lead times and margins.
| Turns a year | Days of cover | Do this first |
|---|---|---|
| Below 1 | More than 365 | Stop reordering. Then work through the options in our dead stock guide. |
| 1 to 4 | 90 to 365 | Order less, or less often. Check whether a minimum order or pack size is forcing too much in. |
| 4 to 12 | 30 to 90 | Usually fine. Leave it alone and spend the time elsewhere. |
| Above 12 | Under 30 | Compare cover with lead time, and check the reorder point. Fast is good until you run out. |
A high ratio is not always good news. The elderberry extract at 35.9 turns has 10 days of cover, which is comfortable only because its lead time is 2 days. Give it a 7-day supplier and the same ratio is a warning.
On Monday, do this: sort the list from low to high, take the ten products holding the most cash below one turn, and cancel any standing reorder on them. It costs nothing.
What is a good inventory turnover ratio?
There is no single good number. It depends on what you sell and how fast your suppliers deliver. One public reference is the US Census Bureau series on retail inventories to sales, which stood at 1.36 in August 2026. Retailers held 1.36 months of sales in stock, or 12 ÷ 1.36 = 8.8 turns a year. That compares stock with sales at selling prices, so it is the flattering version from the table above. We did not find a turnover benchmark for small online shops that traces back to real data, so we are not quoting one.
The better comparison is your own ratio, per product, against itself three months ago.
What Stokis does and does not do here
The Stokis product works from your orders and stock, and here is exactly where turnover stands:
- Whole-shop stock turnover is on Stats, then Operations, then Inventory. It is units sold in the last 30 days × 12 ÷ units on hand, so blank cost prices do not move it.
- Cover per product is on the Sales page, which is free on every plan. In its default 12-month view, 365 ÷ cover is the product's turnover.
- There is no per-product turnover column yet. You do that division yourself.
- It does not calculate a true average inventory. Both figures above use today's stock, with the caution from earlier.
- There is no at-cost turnover ratio. A missing cost price is treated as unknown, never as zero.
Frequently asked questions
What is a good inventory turnover ratio?
It depends on the product and the supplier. Compare each product with its lead time and with its own past. A ratio below one means more than a year of stock on the shelf, which is worth looking at in almost any shop.
Should I use sales or cost of goods sold?
Cost of goods sold. Stock is valued at cost, so sales at selling prices mix two scales and inflate the result, most of all on high-margin products.
How do I calculate turnover without cost prices?
Work per product in units: units sold in twelve months ÷ units in stock. The unit cost cancels, so the answer is the same. Do not add those up into a shop figure at cost.
What is the difference between turnover and days of cover?
They are the same fact in different units. Days of cover is 365 ÷ turnover. Turns suit a financial report, and days suit an ordering decision.
Work it out for your own catalogue
Connect your store and Stokis shows the cover of every product from the order history you already have. Start with the PrestaShop, WooCommerce or OpenCart setup guide. The free trial includes every Growth feature, with no card, and the pricing page shows what comes after.
Sources
AI tools draft parts of our articles; a person checks the facts and edits every one before it is published. Found a mistake? Write to [email protected]. How we write